This website uses cookies to ensure you get the best experience on our website. Read more


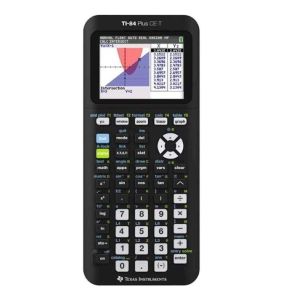
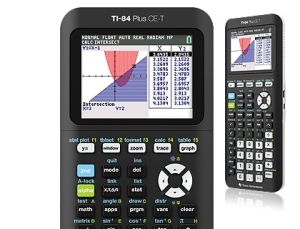

Casio FX-CG50 Graphic Calculator - Color Screen
In stock
SKU
106116
AED 661.50
The all NEW fx-CG50 brings maths to life with the next generation of graphic calculator technologies; including high-resolution colour display with natural textbook display, innovative picture plot function enabling analysis of images and video, and an extensive range of graphic functions.
Overview

Easy-to-operate, high-definition 3D Graph provides visual support for mathematical exploration.
Graphing Scientific Calculator
3D Graph Feature
Take advantage of easy-to-operate, high-definition 3D Graph in mathematics learning that is intuitive and easy to understand.
1Draw and display 3D Graph
3D graphs can be drawn in various ways.
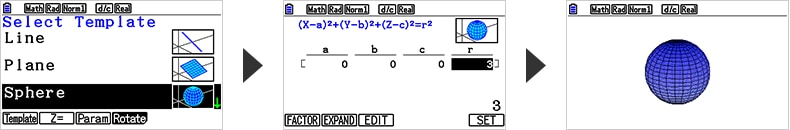
1) Using templates
NEW
It’s easy to draw 3D graphs using templates. (*An industry-first feature)
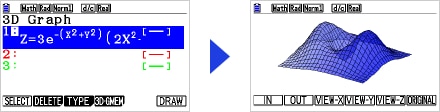
2) Z= graph NEW

3) Parametric graphs NEW

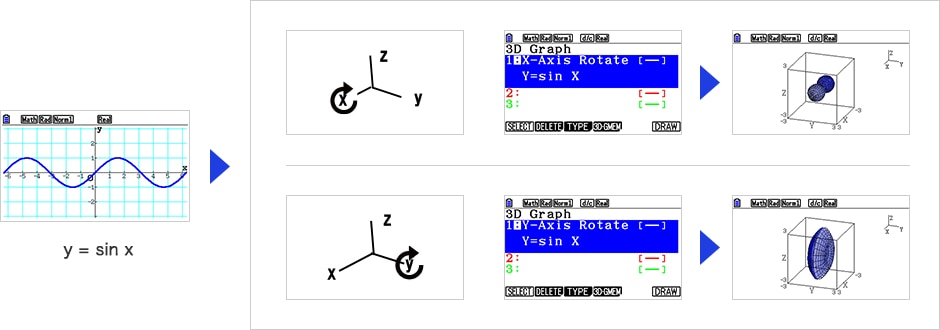
4) Rotating body graphs (① around X-Axis, ② around Y-Axis) NEW *An industry-first feature
Rotating body graphs can be drawn in two ways (rotating around X-Axis or Y-Axis).
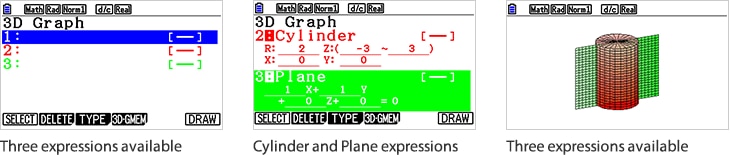
2Draw and display up to three 3D graphs
Recognize combinations of 3D graphs and interactive relationships between two or three graphs mathematically.
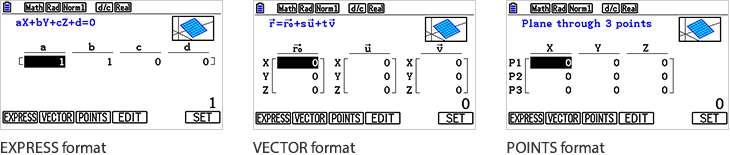
3Investigate the relationship between expressions and 3D graphs
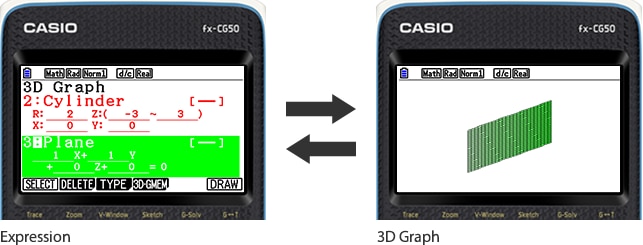
Select EXPRESS, VECTOR, or POINTS format when inputting expressions of 3D graphs.
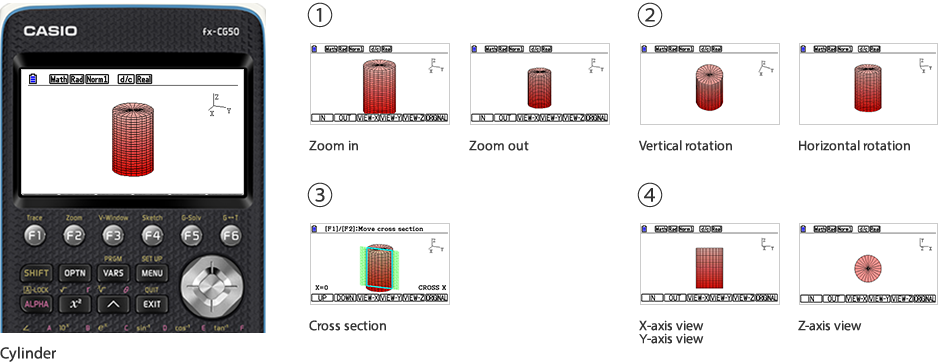
4Explore 3D graphs mathematically
These functions are effective in exploring 3D Graphs geometrically.
1) Viewing from various directions
①Zoom in and zoom out ②Rotation vertically and horizontally ③Cross section ④X-axis, Y-axis, Z-axis view.
These functions are effective in exploring 3D graphs geometrically.
2) Tracing of graphs NEW *An industry-first feature
Explore the coordinates on the surface of 3D graphs (all kinds) by using the cursor keys to move the trace pointer.

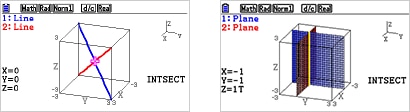
3) Intersection between graphs NEW *An industry-first feature
Explore the intersection (coordinates, line) between 3D graphs (line and line, line and plane, plane and plane).
Expression of the intersection line or the coordinates of intersection
4) Relation between graphs NEW *An industry-first feature
Explore the relationship (parallel, orthogonal, etc.) between 3D graphs (line and line, line and plane, plane and plane).

*Based on CASIO information as of August 2017
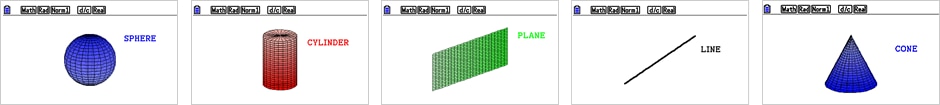
3D Graph Samples
1Z= graph

2Parametric graphs
3Rotating body graphs

Powerful advantage Features
Three key features make the fx-CG50 ideal for mathematics learning.
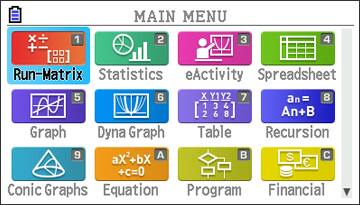
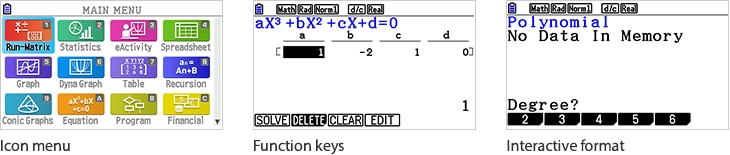
1Intuitive operation
The user-friendly Icon menu, Function keys and Interactive format enable intuitive operation.
2G-Solve feature
Use the G-Solve feature to easily solve problems involving intersections, roots, and integration.
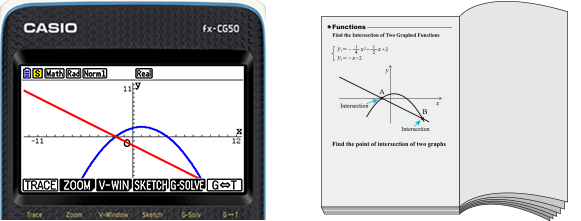
Find the point of intersection of two graphs by simply pressing the "G-Solv" key.


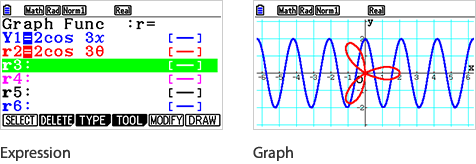
3Explore feature
Freely explore mathematics by drawing graphs on rectangular coordinates and polar coordinates.

Since rectangular coordinates and polar coordinates can be displayed on the same screen, their interaction can be understood.
Effective learning with 3D Graph
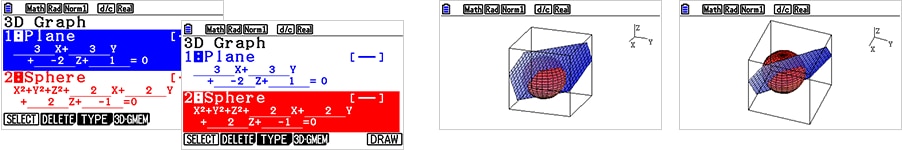
1Draw and display 3D Graph
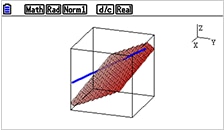
Students get the possibility to visualize the most important intersections between lines, planes and spheres: The intersection point, line or circle. This can be very helpful for them to develop solution strategies.
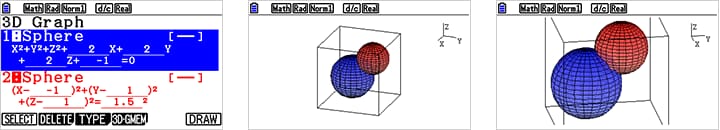
Additionally different input methods are used in all these examples.
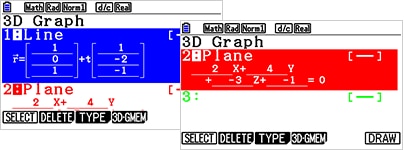
Definition by vector, definition by equation
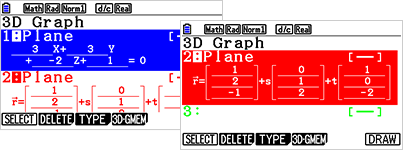
Definition by vector, definition by equation
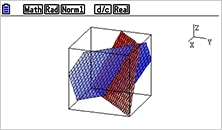
Students can view graphs from various angles, and explore the intersection between 2 objects visually by themselves.
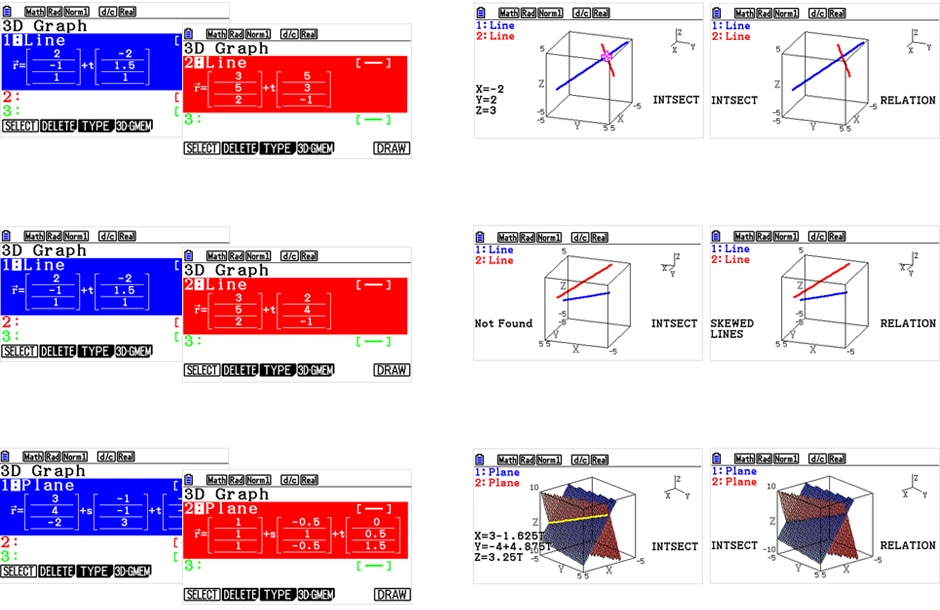
2Explore 3D Graph
Teachers and pupils can study the relationship between lines and planes and can examine their intersections.
Intersection : Intersection point, intersection line or Not Found, etc.
Relation : Intersection, Parallel, Orthogonal, or Skewed lines etc.
E-CON4
1) This feature, with a simple user interface, is effective for collecting data for use in classroom science and technology lessons.
This feature has Auto-ID recognition, which enables automatic drawing of graphs of collected data with no complicated settings.
Effective for Science and Technology Education
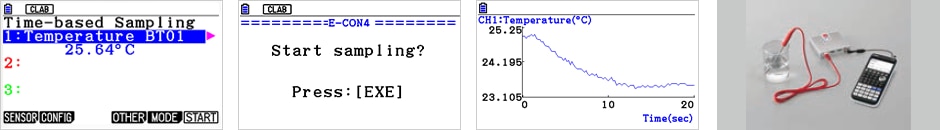
2) Manual Sampling Mode NEW
This feature includes Manual Sampling Mode, which enables you to freely draw graphs of collected data.

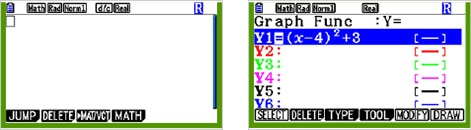
Catalog Function
1) Select the desired command easily and quickly using the catalog function.

2) You can access online manual via smartphone / tablet by using QR Code.” NEW

Examination Mode
This mode allows you to quickly prepare your calculator for exams. This mode restricts access to memory, programs, functions and applications, so that these features would not be available during exams.
Effective for Examinations in school
| Manufacturer | Casio |
|---|---|
| Product Code | FX-CG50 |
| Size | N/A |
Write Your Own Review

